Machine Learning Top Interview Questions & Answers 2018
MACHINE LEARNING
With an increasing popularity for ML, there’s a clear
increase in demand for business professionals and new graduates in this field
of technology. Coming to the job role, an ML engineer utilises his or her
understanding of mathematics coupled with strong programming skills to solve
tech-oriented problems.
Machine learning interview questions are an integral part of
the data science interview and the path to becoming a data scientist, machine
learning engineer or data engineer.
Here we present the top interview questions that are
generally asked in companies to assess the candidate’s expertise in machine
learning.
General
Questions:
Q1.What is
Machine Learning?
Machine learning is a subset of artificial intelligence in
the field of computer science that often uses statistical techniques to give
computers the ability to "learn" with data, without being explicitly
programmed.
Q2. How is ML different from
artificial intelligence?
AI involves machines that execute tasks which are programmed
and based on human intelligence, whereas ML is a subset application of AI where
machines are made to learn information. They gradually perform tasks and can
automatically build models from the learnings.
Q3. Mention the difference
between Data Mining and Machine learning?
Machine learning relates with the study, design and
development of the algorithms that give computers the capability to learn
without being explicitly programmed.
While, data mining can be defined as the process in which the
unstructured data tries to extract knowledge or unknown interesting
patterns. During this process machine,
learning algorithms are used.
Q4. What is inductive machine
learning?
The inductive machine learning involves the process of
learning by examples, where a system, from a set of observed instances tries to
induce a general rule.
Q5. What is ‘Overfitting’ in Machine learning?
In machine learning, when a
statistical model describes random error or noise instead of underlying
relationship ‘overfitting’ occurs. When a model is excessively complex,
overfitting is normally observed, because of having too many parameters with
respect to the number of training data types. The model exhibits poor
performance which has been overfit.
Q6. Why causes overfitting?
The possibility of
overfitting exists as the criteria used for training the model is not the same
as the criteria used to judge the efficacy of a model.
Q7. What are the basic differences between Machine Learning
and Deep Learning
|
Machine Learning Vs Deep Learning
|
||
|
|
Machine Learning
|
Deep Learning
|
|
Definition
|
Sub-discipline of AI
|
Subset of machine learning
|
|
Data
|
Parses the data
|
Creates an artificial neural network
|
|
Accuracy
|
Requires manual intervention means
decreased accuracy
|
Self-learning capabilities mean higher
accuracy
|
|
Interpretability
|
Machine Learning is Faster
|
10 Times Faster than ML
|
|
Output
|
ML models produce a numerical output
|
DL algorithms can range from an image to
text or even an audio
|
|
Data dependencies
|
High
|
Low
|
|
Hardware dependencies
|
Can work on low-end machines.
|
Heavily depend on high-end machines
|
|
Future
|
Effective with image recognition and face
recognition in mobiles
|
Not much effective due to data processing
limitations
|
Q8.What are neural
networks and where do they find their application in ML? Elaborate.
Neural networks are information processing models that
derive their functions based on biological neurons found in the human brain.
The reason they are the choice of technique in ML is because, they help
discover patterns in data that are sometimes too complex to comprehend by
humans.
Q9. What are the five
popular algorithms of Machine Learning?
a) Decision Trees
b) Neural
Networks (back propagation)
c) Probabilistic
networks
d) Nearest
Neighbor
e) Support vector
machines
Q10. What are the different Algorithm
techniques in Machine Learning?
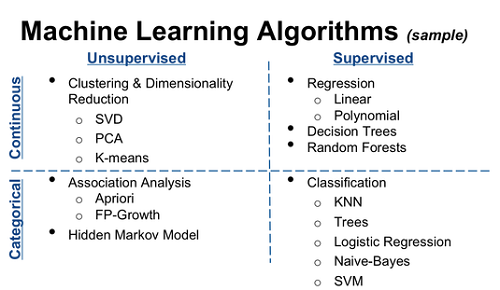
The different types of techniques in Machine Learning are
a) Supervised
Learning
b) Unsupervised
Learning
c)
Semi-supervised Learning
d) Reinforcement
Learning
e) Transduction
f) Learning to
Learn
Q11. What are the
three stages to build the hypotheses or model in machine learning?
a) Model building
b) Model testing
c) Applying the
model
Q12. What is the
difference between supervised and unsupervised machine learning?
A Supervised learning is a process where it requires
training labeled data. When it comes to
Unsupervised learning it doesn’t require data labeling.
Q13. What is ‘tuning’
in ML?
Generally, the goal of ML is to automatically provide
accurate output from the vast amounts of input data without human intervention.
Tuning is a process which makes this possible and it involves optimising
hyperparameters for an algorithm or a ML model to make them perform correctly.
Q14. What is
optimisation in ML?
Optimisation in general refers to minimising or maximising
an objective function (in linear programming). In the context of ML,
optimisation refers to tuning of hyperparameters which result in minimising the
error function (or loss function).
Q15. What is the
difference between Bias and Variance?
Bias:
Bias can be defined as a situation where an error has
occurred due to use of assumptions in the learning algorithm.
Variance:
Variance is an error caused because of the complexity of the
algorithm that is been used to analyze the data.
Q16. Differentiate
between a parameter and a hyperparameter?
Parameters are attributes in training data that can be
estimated during ML. Hyperparameters are attributes that cannot be determined
beforehand in the training data. Example: Learning rate in neural networks.
Q17.What is ‘tuning’
in ML?
Generally, the goal of ML is to automatically provide
accurate output from the vast amounts of input data without human intervention.
Tuning is a process which makes this possible and it involves optimising
hyperparameters for an algorithm or a ML model to make them perform correctly.
Q18.What is
optimisation in ML?
Optimisation in general refers to minimising or maximising
an objective function (in linear programming). In the context of ML,
optimisation refers to tuning of hyperparameters which result in minimising the
error function (or loss function).
Q19.What is the use
of gradient descent?
The use of gradient descent plainly lies with the fact that
it is easy to implement and is compatible with most of the ML algorithms when
it comes to optimisation. This technique works on the principle of cost
function.
Q20. Explain what is
precision and Recall?
Recall:
It is known as a true positive rate. The number of positives
that your model has claimed compared to the actual defined number of positives
available throughout the data.
Precision:
It is also known as a positive predicted value. This is more
based on the prediction. It is a measure of a number of accurate positives that
the model claims when compared to the number of positives it actually claims.
Q20 What is the
difference between Type 1 and Type 2 errors?
Type 1 error is classified as a false positive. I.e. This
error claims that something has happened but the fact is nothing has happened.
It is like a false fire alarm. The alarm rings but there is no fire.
Type 2 error is classified as a false negative. I.e. This
error claims that nothing has happened but the fact is that actually, something
happened at the instance.
The best way to differentiate a type 1 vs type 2 error is:
Calling a man to be pregnant- This is Type 1 example
Calling pregnant women and telling that she isn’t carrying
any baby- This is type 2 example.
Q21. List down
various approaches for machine learning?
The different approaches in Machine Learning are
a) Concept Vs
Classification Learning
b) Symbolic Vs
Statistical Learning
c) Inductive Vs
Analytical Learning
Q22. Explain what is
the function of ‘Unsupervised Learning’?
a) Find clusters
of the data
b) Find
low-dimensional representations of the data
c) Find
interesting directions in data
d) Interesting
coordinates and correlations
e) Find novel
observations/ database cleaning
Q23 Explain what is the function of ‘Supervised
Learning’?
a)
Classifications
b) Speech
recognition
c) Regression
d) Predict time
series
e) Annotate
strings
Q24. Explain Principal
Component Analysis (PCA).
PCA is a dimensionality-reduction technique which
mathematically transforms a set of correlated variables into a smaller set of
uncorrelated variables called principal components.
Q25. Is rotation
necessary in PCA? If yes, Why? What will happen if you don’t rotate the
components?
Answer: Yes, rotation (orthogonal) is necessary because it
maximizes the difference between variance captured by the component. This makes
the components easier to interpret. Not to forget, that’s the motive of doing
PCA where, we aim to select fewer components (than features) which can explain
the maximum variance in the data set. By doing rotation, the relative location
of the components doesn’t change, it only changes the actual coordinates of the
points.
If we don’t rotate the components, the effect of PCA will
diminish and we’ll have to select more number of components to explain variance
in the data set.
Q26. What is the F1 score?
The F1 score is defined as a measure of a model’s
performance.
Q27. How is F1 score
is used?
The average of Precision and Recall of a model is nothing
but F1 score measure. Based on the results, the F1 score is 1 then it is
classified as best and 0 being the worst.
Q28. Explain any data
preprocessing technique for ML.
Standardisation: It is mainly used for algorithms following
a Gaussian distribution. It can be done through scikit learn Standardscaler
class (for Python).
Q29. What value do
you optimise when using a support vector machine (SVM)?
For a linear function, SVM optimises the product of input
vectors as well as the coefficients. In other words, the algorithm with the
linear function can be restructured into a dot-product.
Q30. On what basis do
you choose a classifier?
Classifiers must be chosen based on the accuracy it provides
on the trained data. Also, the size of the dataset sometimes affects accuracy.
For example, Naive Bayes classifiers suit smaller datasets in terms of accuracy
due to higher asymptotic errors.
Q31.Which is better
for image classification- Supervised or unsupervised classification.? Justify.
In a supervised classification, the images are interpreted
manually by the ML expert to create feature classes whereas this is not the
case in unsupervised classification wherein the ML software creates feature
classes based on image pixel values. Therefore, it is better to opt for
supervised classification for image classification in terms of accuracy.
Q32. Explain the
Bias-Variance Tradeoff.
Predictive models have a tradeoff between bias (how well the
model fits the data) and variance (how much the model changes based on changes
in the inputs).
Simpler models are stable (low variance) but they don't get
close to the truth (high bias).
More complex models are more prone to being overfit (high
variance) but they are expressive enough to get close to the truth (low bias).
The best model for a given problem usually lies somewhere in
the middle.

Q33. Why is naive
Bayes so ‘naive’ ?
Naive Bayes is so ‘naive’ because it assumes that all of the
features in a data set are equally important and independent. As we know, these
assumption are rarely true in real world scenario.
Q34. Explain prior
probability, likelihood and marginal likelihood in context of naiveBayes
algorithm?
Prior probability is
nothing but, the proportion of dependent (binary) variable in the data set. It
is the closest guess you can make about a class, without any further
information. For example: In a data set, the dependent variable is binary (1
and 0). The proportion of 1 (spam) is 70% and 0 (not spam) is 30%. Hence, we
can estimate that there are 70% chances that any new email would be classified as spam.
Likelihood is the probability of classifying a given
observation as 1 in presence of some other variable. For example: The
probability that the word ‘FREE’ is used in previous spam message is
likelihood. Marginal likelihood is, the probability that the word ‘FREE’ is
used in any message.
Q35. What are the
three stages to build the model in machine learning:
Model building
Model testing
Applying the model
Q36. How Recall and
True positive rate are related?
The relation is
True Positive Rate = Recall.
Q37. Assume that you
are working on a data set, explain how would you select important variables?
The following are few methods can be used to select
important variables:
Use of Lasso Regression method.
Using Random Forest, plot variable importance chart.
Using Linear regression.
Q38. Explain how we
can capture the correlation between continuous and categorical variable?
Yes, it is possible by using ANCOVA technique. It stands for
Analysis of Covariance.
It is used to calculate the association between continuous
and categorical variables
Q39. How is KNN different
from k-means clustering?
K-Nearest Neighbors is a supervised classification
algorithm, while k-means clustering is an unsupervised clustering algorithm.
While the mechanisms may seem similar at first, what this really means is that
in order for K-Nearest Neighbors to work, you need labeled data you want to
classify an unlabeled point into (thus the nearest neighbor part). K-means
clustering requires only a set of unlabeled points and a threshold: the
algorithm will take unlabeled points and gradually learn how to cluster them
into groups by computing the mean of the distance between different points.
The critical difference here is that KNN needs labeled
points and is thus supervised learning, while k-means doesn’t — and is thus
unsupervised learning.
Q40. What is Bayes’
Theorem? How is it useful in a machine learning context?
Bayes’ Theorem gives you the posterior probability of an
event given what is known as prior knowledge.
Mathematically, it’s expressed as the true positive rate of
a condition sample divided by the sum of the false positive rate of the
population and the true positive rate of a condition. Say you had a 60% chance
of actually having the flu after a flu test, but out of people who had the flu,
the test will be false 50% of the time, and the overall population only has a
5% chance of having the flu. Would you actually have a 60% chance of having the
flu after having a positive test?
Bayes’ Theorem says no. It says that you have a (.6 * 0.05)
(True Positive Rate of a Condition Sample) / (.6*0.05)(True Positive Rate of a
Condition Sample) + (.5*0.95) (False Positive Rate of a Population) = 0.0594 or 5.94% chance of getting a flu.
Q41. Explain the
difference between L1 and L2 regularization.
L2 regularization tends to spread error among all the terms,
while L1 is more binary/sparse, with many variables either being assigned a 1
or 0 in weighting. L1 corresponds to setting a Laplacean prior on the terms,
while L2 corresponds to a Gaussian prior.

Q42. What’s a Fourier transform?
A Fourier transform is a generic method to decompose generic
functions into a superposition of symmetric functions. Or as this more
intuitive tutorial puts it, given a smoothie, it’s how we find the recipe. The
Fourier transform finds the set of cycle speeds, amplitudes and phases to match
any time signal. A Fourier transform converts a signal from time to frequency
domain — it’s a very common way to extract features from audio signals or other
time series such as sensor data.
Q43. What is deep
learning, and how does it contrast with other machine learning algorithms?
Deep learning is a subset of machine learning that is
concerned with neural networks: how to use backpropagation and certain
principles from neuroscience to more accurately model large sets of unlabelled
or semi-structured data. In that sense, deep learning represents an
unsupervised learning algorithm that learns representations of data through the
use of neural nets.
Q44. What’s the
difference between a generative and discriminative model?
A generative model will learn categories of data while a
discriminative model will simply learn the distinction between different
categories of data. Discriminative models will generally outperform generative
models on classification tasks.
Q45. What
cross-validation technique would you use on a time series dataset?
Instead of using standard k-folds cross-validation, you have
to pay attention to the fact that a time series is not randomly distributed
data — it is inherently ordered by chronological order. If a pattern emerges in
later time periods for example, your model may still pick up on it even if that
effect doesn’t hold in earlier years!
You’ll want to do something like forward chaining where
you’ll be able to model on past data then look at forward-facing data.
fold 1 : training [1], test [2]
fold 2 : training [1 2], test [3]
fold 3 : training [1 2 3], test [4]
fold 4 : training [1 2 3 4], test [5]
fold 5 : training [1 2 3 4 5], test [6]
Q46. What are the
advantages and disadvantages of decision trees?
Advantages: Decision trees are easy to interpret,
nonparametric (which means they are robust to outliers), and there are
relatively few parameters to tune.
Disadvantages: Decision trees are prone to be overfit.
However, this can be addressed by ensemble methods like random forests or
boosted trees.
Q47. What are the
advantages and disadvantages of neural networks?
Advantages: Neural networks (specifically deep NNs) have led
to performance breakthroughs for unstructured datasets such as images, audio,
and video. Their incredible flexibility allows them to learn patterns that no
other ML algorithm can learn.
Disadvantages: However, they require a large amount of
training data to converge. It's also difficult to pick the right architecture,
and the internal "hidden" layers are incomprehensible.
Q48. How can you
choose a classifier based on training set size?
If training set is small, high bias / low variance models
(e.g. Naive Bayes) tend to perform better because they are less likely to be
overfit.
If training set is large, low bias / high variance models
(e.g. Logistic Regression) tend to perform better because they can reflect more
complex relationships.
Q49. Explain Latent
Dirichlet Allocation (LDA).
Latent Dirichlet Allocation (LDA) is a common method of
topic modeling, or classifying documents by subject matter.
LDA is a generative model that represents documents as a
mixture of topics that each have their own probability distribution of possible
words.
The "Dirichlet" distribution is simply a distribution
of distributions. In LDA, documents are distributions of topics that are
distributions of words.
Q50. What is the ROC
Curve and what is AUC (a.k.a. AUROC)?
The ROC (receiver operating characteristic) the performance
plot for binary classifiers of True Positive Rate (y-axis) vs. False Positive
Rate (x-axis).
AUC is area under the ROC curve, and it's a common
performance metric for evaluating binary classification models.
It's equivalent to the expected probability that a uniformly
drawn random positive is ranked before a uniformly drawn random negative.
Q51. Why is Area
Under ROC Curve (AUROC) better than raw accuracy as an out-of- sample
evaluation metric?
AUROC is robust to class imbalance, unlike raw accuracy.
For example, if you want to detect a type of cancer that's
prevalent in only 1% of the population, you can build a model that achieves 99%
accuracy by simply classifying everyone has cancer-free.

Q52. How is a
decision tree pruned?
Pruning is what happens in decision trees when branches that
have weak predictive power are removed in order to reduce the complexity of the
model and increase the predictive accuracy of a decision tree model. Pruning
can happen bottom-up and top-down, with approaches such as reduced error
pruning and cost complexity pruning.
Reduced error pruning is perhaps the simplest version:
replace each node. If it doesn’t decrease predictive accuracy, keep it pruned.
While simple, this heuristic actually comes pretty close to an approach that
would optimize for maximum accuracy.
Q53. Which is more
important to you– model accuracy, or model performance?
This question tests your grasp of the nuances of machine
learning model performance! Machine learning interview questions often look
towards the details. There are models with higher accuracy that can perform
worse in predictive power — how does that make sense?
Well, it has everything to do with how model accuracy is
only a subset of model performance, and at that, a sometimes misleading one.
For example, if you wanted to detect fraud in a massive dataset with a sample
of millions, a more accurate model would most likely predict no fraud at all if
only a vast minority of cases were fraud. However, this would be useless for a
predictive model — a model designed to find fraud that asserted there was no
fraud at all! Questions like this help you demonstrate that you understand
model accuracy isn’t the be-all and end-all of model performance.
Q54. How would you
handle an imbalanced dataset?
An imbalanced dataset is when you have, for example, a
classification test and 90% of the data is in one class. That leads to
problems: an accuracy of 90% can be skewed if you have no predictive power on
the other category of data! Here are a few tactics to get over the hump:
1- Collect more data to even the imbalances in the dataset.
2- Resample the dataset to correct for imbalances.
3- Try a different algorithm altogether on your dataset.
What’s important here is that you have a keen sense for what
damage an unbalanced dataset can cause, and how to balance that.
Q55. Why are ensemble
methods superior to individual models?
They average out biases, reduce variance, and are less
likely to overfit.
There's a common line in machine learning which is:
"ensemble and get 2%."
This implies that you can build your models as usual and
typically expect a small performance boost from ensembling.
Q56. Explain bagging.
Bagging, or Bootstrap Aggregating, is an ensemble method in
which the dataset is first divided into multiple subsets through resampling.
Then, each subset is used to train a model, and the final
predictions are made through voting or averaging the component models.
Bagging is performed in parallel.

Q57. Name an example
where ensemble techniques might be useful.
Ensemble techniques use a combination of learning algorithms
to optimize better predictive performance. They typically reduce overfitting in
models and make the model more robust (unlikely to be influenced by small
changes in the training data).
You could list some examples of ensemble methods, from
bagging to boosting to a “bucket of models” method and demonstrate how they
could increase predictive power.
Q58. How would you
evaluate a logistic regression model?
A subsection of the question above. You have to demonstrate
an understanding of what the typical goals of a logistic regression are
(classification, prediction etc.) and bring up a few examples and use cases.
Q59. What’s the
“kernel trick” and how is it useful?
The Kernel trick involves kernel functions that can enable
in higher-dimension spaces without explicitly calculating the coordinates of
points within that dimension: instead, kernel functions compute the inner
products between the images of all pairs of data in a feature space. This
allows them the very useful attribute of calculating the coordinates of higher
dimensions while being computationally cheaper than the explicit calculation of
said coordinates. Many algorithms can be expressed in terms of inner products.
Using the kernel trick enables us effectively run
algorithms in a high-dimensional space with lower-dimensional data.
Q60. Pick an
algorithm. Write the psuedo-code for a parallel implementation.
This kind of question demonstrates your ability to think in
parallelism and how you could handle concurrency in programming implementations
dealing with big data. Take a look at pseudocode frameworks such as Peril-L and
visualization tools such as Web Sequence Diagrams to help you demonstrate your
ability to write code that reflects parallelism.
Q61. Describe a hash
table.
A hash table is a data structure that produces an
associative array. A key is mapped to certain values through the use of a hash
function. They are often used for tasks such as database indexing.

Q62. - How can we use
your machine learning skills to generate revenue?
This is a tricky question. The ideal answer would
demonstrate knowledge of what drives the business and how your skills could
relate. For example, if you were interviewing for music-streaming startup
Spotify, you could remark that your skills at developing a better
recommendation model would increase user retention, which would then increase
revenue in the long run.
Q63. You are given a
data set on cancer detection. You’ve build a classification model and achieved
an accuracy of 96%. Why shouldn’t you be happy with your model performance?
What can you do about it?
If you have worked on enough data sets, you should deduce
that cancer detection results in imbalanced data. In an imbalanced data set,
accuracy should not be used as a measure of performance because 96% (as given)
might only be predicting majority class correctly, but our class of interest is
minority class (4%) which is the people who actually got diagnosed with cancer.
Hence, in order to evaluate model performance, we should use Sensitivity (True
Positive Rate), Specificity (True Negative Rate), F measure to determine class
wise performance of the classifier. If the minority class performance is found
to to be poor, we can undertake the following steps:
We can use undersampling, oversampling or SMOTE to make the
data balanced.
We can alter the prediction threshold value by doing
probability caliberation and finding a optimal threshold using AUC-ROC curve.
We can assign weight to classes such that the minority
classes gets larger weight.
We can also use
anomaly detection.
Q64. You came to know
that your model is suffering from low bias and high variance. Which algorithm
should you use to tackle it? Why?
Low bias occurs when the model’s predicted values are near
to actual values. In other words, the model becomes flexible enough to mimic
the training data distribution. While it sounds like great achievement, but not
to forget, a flexible model has no generalization capabilities. It means, when
this model is tested on an unseen data, it gives disappointing results.
In such situations, we can use bagging algorithm (like
random forest) to tackle high variance problem. Bagging algorithms divides a
data set into subsets made with repeated randomized sampling. Then, these
samples are used to generate a set of
models using a single learning algorithm. Later, the model predictions are
combined using voting (classification) or averaging (regression).
Also, to combat high variance, we can:
Use regularization technique, where higher model
coefficients get penalized, hence lowering model complexity.
Use top n features from variable importance chart. May be,
with all the variable in the data set, the algorithm is having difficulty in
finding the meaningful signal.
Q65. While working on
a data set, how do you select important variables? Explain your methods.
Following are the methods of variable selection you can use:
Remove the correlated variables prior to selecting important
variables
Use linear regression and select variables based on p values
Use Forward Selection, Backward Selection, Stepwise
Selection
Use Random Forest, Xgboost and plot variable importance
chart
Use Lasso Regression
Measure information gain for the available set of features
and select top n features accordingly.
Q66. What is the
difference between covariance and correlation?
Correlation is the
standardized form of covariance.
Covariances are difficult to compare. For example: if we
calculate the covariances of salary ($) and age (years), we’ll get different
covariances which can’t be compared because of having unequal scales. To combat
such situation, we calculate correlation to get a value between -1 and 1,
irrespective of their respective scale.
Q67. Is it possible capture the correlation between
continuous and categorical variable? If yes, how?
Yes, we can use
ANCOVA (analysis of covariance) technique to capture association between
continuous and categorical variables.
Q68. Both being tree
based algorithm, how is random forest different from Gradient boosting
algorithm (GBM)?
The fundamental difference is, random forest uses bagging
technique to make predictions. GBM uses boosting techniques to make
predictions.
In bagging technique, a data set is divided into n samples
using randomized sampling. Then, using a single learning algorithm a model is
build on all samples. Later, the resultant predictions are combined using
voting or averaging. Bagging is done is parallel. In boosting, after the first
round of predictions, the algorithm weighs misclassified predictions higher,
such that they can be corrected in the succeeding round. This sequential
process of giving higher weights to misclassified predictions continue until a
stopping criterion is reached.
Random forest improves model accuracy by reducing variance
(mainly). The trees grown are uncorrelated to maximize the decrease in
variance. On the other hand, GBM improves accuracy my reducing both bias and
variance in a model.
Q69. You’ve got a
data set to work having p (no. of variable) > n (no. of observation). Why is
OLS as bad option to work with? Which techniques would be best to use? Why?
In such high dimensional data sets, we can’t use classical
regression techniques, since their assumptions tend to fail. When p > n, we
can no longer calculate a unique least square coefficient estimate, the
variances become infinite, so OLS cannot be used at all.
To combat this situation, we can use penalized regression
methods like lasso, LARS, ridge which can shrink the coefficients to reduce
variance. Precisely, ridge regression works best in situations where the least
square estimates have higher variance.
Among other methods include subset regression, forward
stepwise regression.
Q70. ‘People who
bought this, also bought…’ recommendations seen on amazon is a result of which
algorithm?
The basic idea for this kind of recommendation engine comes
from collaborative filtering.
Collaborative Filtering algorithm considers “User Behavior”
for recommending items. They exploit behavior of other users and items in terms
of transaction history, ratings, selection and purchase information. Other
users behaviour and preferences over the items are used to recommend items to
the new users. In this case, features of the items are not known.
Q71. In k-means or
kNN, we use euclidean distance to calculate the distance between nearest
neighbors. Why not manhattan distance ?
We don’t use
manhattan distance because it calculates distance horizontally or vertically
only. It has dimension restrictions. On the other hand, euclidean metric can be
used in any space to calculate distance. Since, the data points can be present
in any dimension, euclidean distance is a more viable option.
Example: Think of a chess board, the movement made by a
bishop or a rook is calculated by manhattan distance because of their
respective vertical & horizontal movements.
Q72.When does regularization becomes necessary in Machine
Learning?
Regularization becomes necessary when the model begins to
ovefit / underfit. This technique introduces a cost term for bringing in more
features with the objective function. Hence, it tries to push the coefficients
for many variables to zero and hence reduce cost term. This helps to reduce model
complexity so that the model can become better at predicting (generalizing).
Q73. What do you
understand by Bias Variance trade off?
The error emerging
from any model can be broken down into three components mathematically.
Following are these component :

Q74. What are some
key business metrics for (S-a-a-S startup | Retail bank | e-Commerce site)?
Thinking about key business metrics, often shortened as
KPI's (Key Performance Indicators), is an essential part of a data scientist's
job. Here are a few examples, but you should practice brainstorming your own.
Tip: When in doubt, start with the easier question of
"how does this business make money?"
S-a-a-S startup :
Customer lifetime value, new accounts, account lifetime, churn rate, usage
rate, social share rate
Retail bank: Offline leads, online leads, new accounts
(segmented by account type), risk factors, product affinities
e-Commerce: Product sales, average cart value, cart
abandonment rate, email leads, conversion rate.
Q75 How can you help
our marketing team be more efficient?
The answer will depend on the type of company. Here are some
examples.
Clustering algorithms
to build custom customer segments for each type of marketing campaign.
Natural language processing
for headlines to predict performance
before running ad spend.
Predict conversion probability based on a user's website
behaviour in order to create better re-targeting campaigns.

Best article, very useful and explanation. Your post is extremely incredible. Thank you very much for the new information.
ReplyDeleteBest RPA UiPath Online Training in Hyderabad
RPA UiPath Training
RPA UiPath Training in Hyderabad
RPA UiPath Training in Ameerpet
ReplyDeleteVery nice post with lots of information. Thanks for sharing this
UI Path Online Training
UI Path Training in Hyderabad
Text Analytics Tool
ReplyDeleteData Analytics Solutions
Very nice blog brother ,keep it up.Machine learning course in Bangalore
ReplyDeleteWebsite Builder:Elementor Vs Divi
ReplyDeleteHi, Amazing you know this article helping for me and everyone and thanks for sharing information Core
ReplyDeletecorporate event organisers in chennai
top corporate event management companies in chennai
best corporate event organisers in chennai
corporate event management companies in chennai
A very nice guide. I will definitely follow these tips. Thank you for sharing such detailed article. I am learning a lot from you.
ReplyDeleteevent organizers in chennai
event organiser in chennai
This post gave me a lot of information on this topic. Keep it up and keep sharing this type of information with us. Try to explore our services towards digital transformation.
ReplyDeleteData Analytics Solutions
Data Engineering Solutions
Artificial Intelligence (AI) Solutions
I cannot thank you enough for the blog.Thanks Again. Keep writing.
ReplyDeletebest machine learning course in hyderabad